Risk Assessment
- Overview of methods for chemical plants and petroleum refineries
- Assist the practicing engineer in risk assessment, management and mitigation
- Provide sources for additional information
Organization
Twelve Topics on Detection, Prevention and Mitigation
Assist the practicing engineer in risk assessment, management and mitigation
Continuing professional development credit for three hours
E-Mail critique to LSU for certificate: pike@lsu.edu
1.1 Introduction
- Starting Point
- Elements of a Risk Management Program
- Perceptions about Risk
- Public
- Engineer
- Perspective of the Life of a Plant
- Hazard Identification and Assessment
- Risk Mitigation
- Operator and Emergency Response Training
- Audits
- Emergency Response Planning and Procedures
- Incident and Accident Investigation
Public
- Subjective
- Qualitative
- Irrational
- Intuitive
- Misperception
Expert
- Objective
- Quantitative
- Rational
- Logical
- Reality
Risk
Probability x Consequences
Risk Perceptions
Public versus Expert
1.5 General Observations by SocietyAcceptable Risks
- Known
- Old
- Gradual
- Usual
- Natural
- Voluntary
- Controllable by Individual
- Necessary
- Profitable for Individual
Unacceptable Risks
- Unknown
- New
- Sudden
- Unusual
- Manmade
- Involuntary
- Uncontrollable by Individual
- Luxury
- Not Profitable for Individual
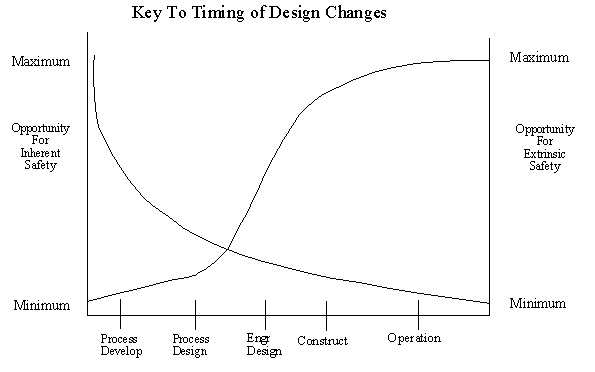
Inherent Safety: Potential Dangers have been removed rather than designed for
Extrinsic Safety: Safety is built in by adding controls, alarms, interlocks,equipment procedures, & other mechanisms
1.7. Life of Plant
2.1. Risk Management Programs
- A Management Tool
- Ensures Consistent Response
- Credible
- Organized
- Thorough (addressing public concerns)
- Relevant
- Doable & Economical
- Based on Existing Technology
- Publicized
- Hazard Identification
- Consequence Analysis
- Control or Treatment Responses
- Procedures
- Training
- Emergency
- Planning
- Accident Investigation
- Audits
- What-If Analysis
- HAZOP
- Fault Tree Analysis (FTA)
- Failure Modes and Effects Analysis (FMEA)
Determines the consequences of an undesired event identified by a hazard evaluation
Site Specific
- Considers:
- Hazard
- Location
- Population Density
- Weather Pattern
Control potential releases and consequences
Control program
- operations
- maintenance
- safety
- training
- audit
- investigation
- Human Error
- Classroom vs. On-the-Job
- Performance Evaluations
- Refresher Courses
- Instructors
- Measure Effectiveness
- Uses Consequence Analysis
- Emergency Organization
- Practice Emergency Response
- Required by Federal Regulations
- Accident Investigation Team
- Comprehensive Investigation
- Determine cause and effect
- Measures to prevent reoccurrence
- Report detailing facilities operation, conclusions, recommendations, actions and resolution
- Review of operations and maintenance procedures
- Inventory of records
- Physical inspections
- Review of documentation
- Administrative procedures for tracking and checking program implementation
- Performed yearly
- State Regulations
- Federal Clean Air Act Amendments (CAAA)
- Occupational Safety & Health Administration (OSHA)
- Industry Guidelines
- Process Safety
- Process Hazard Analysis
- Management of Change
- Operating Procedures
- Safe Work Practices
- Audits
- Training
- Integrity of Critical Equipment
- Pre-Start Up Safety Review
- Emergency Response & Control
- Investigation of Process Related Incidents
- A key element of risk management is plant operating procedures
- Design and plant engineers are responsible for providing clear instructions for both normal operating conditions and any foreseen emergency conditions
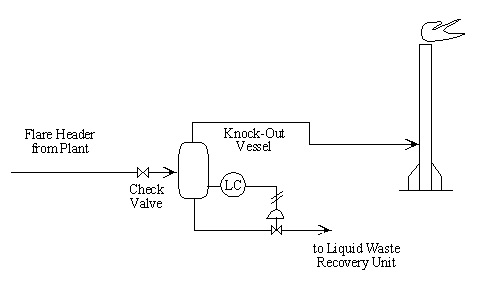
- Write operating procedures for “high liquid level alarm sounds” for the knock-out vessel. The alarm on the liquid level controller is set for no more than 20% liquid in the vessel.
- Confirm liquid level is actually high: Describe how to determine actual level
- Check liquid level control unit: Describe action to be taken
- Check outlet path: Describe possibilities and actions
- Check inlet path: Describe possibilities and actions
- Describe action to be taken and who is to be notified
- Confirm that liquid level actually is high. The level might be OK.
Instruments may not be 100% reliable.- Check sight glass on vessel to confirm high level.
- If high level is confirmed, go on to 2.
- If high level does not exist, check and repair liquid level alarm unit.
- Check sight glass on vessel to confirm high level.
- Check liquid level control unit. The controller may be malfunctioning.
- If controller is OK, go to 3.
- If controller is faulty, shift operation to manual control and repair level controller.
- Check outlet path. The outlet path may be blocked. Inspect for blockages and sources
of back pressure between vessel and waste liquid recovery unit.
- If no blockage, go on to 4.
- If blockage exists, arrange for clearance and repair.
- Check inlet path. There may be excessive flow to the unit.
- If no flow, go on to 5.
- If flow is satisfactory, check with unit operators to see if excessive amounts of
liquid are expected.
- If unit operators know excessive amounts of liquid are being sent to flare, determine expected time for vessel to fill. Find out from unit operators whether their problem will be under control by then.
- If unit operators are not aware of excessive flow, assist them in determining source.
- Inform unit operators that there is no vapor vent flow to flare. Be sure that everyone
involved knows the conditions of the system.
- If unit operators are aware of this and unit is under control (or shut down), allow vessel liquid level to stabilize.
- If unit operators are not aware of problem, assist as needed to get unit operating properly.
3.1. Screening Analysis Techniques
3.2. Dow Fire and Explosion Index
Purpose: To Realize the Realistic Loss Potential of the Process Under Consideration
Methodology:
- Quantify Anticipated Damage
- Identify Contributors to Incidents
- Communicate The Risk Potential To Management
Basic Procedures
- Select Process
- Find Hazard Factor
- Calculate Index
- Conduct Risk Analysis
- Calculate Base MPPD
- Audits
- Calculate Loss Control Credit
- Factors
- Calculate Actual MPPD
- Determine Maximum Probable Days Outage and Business Interruption
3.3. Dow Fire and Explosion Index(contd.)
3.4. Loss Control Credit Factors
3.5. Unit Analysis Summary
3.6. Mond Fire, Explosion and Toxicity Index
3.7. Recommendations
- Place Potentially Hazardous Equipment Away From Vicinity of Personnel
- Space Units To Minimize Adverse Effects From Unsafe Incidents
- Arrange Plant to Minimize Adverse Effects on Nearby Property
- Group Small-Potentially Hazardous Equipment Together
- Provide Unrestricted Access for Rescue and Firefighters
- Divide Plant into Units or Processes
- For Each Unit Identify:
- Hazards of Entering & Exiting Materials
- Equipment
- Process
- Rate Each Component of the Unit
-
Review Acceptability of Identified Hazards
-
Minimize Hazards or Examine Accuracy of Unit Ranking Procedure
-
Prepare Credits for Overall Risk Factor Reduction
- Indices and Databases
- Reduce the Amount of Detailed Hazard Analysis by Screening Out Unimportant Chemicals and Processes
- Substance Hazard Index (API RP 750)
- Hazardous Chemicals Data (NFC49)
- Extremely Hazardous Substance List (EPA 40 CFR 355)
- CAMEO Response Information Data Sheets (NOAA)
- Limit Values and Biological Exposure Indices
Toxicity
- Lethal at low concentrations
- Readily vaporize into atmosphere
- Easily ingested
Flammability
- Pyrophoric materials
- Liquids with low flash points and ignition points
- capable of exothermic reactions
Reactivity
- Strong oxidizers
- Capable of detonation
Distinguishes Chemical Substances by their Vapor Pressures and Toxicity ratings
SHI= EVC/ATCEVC: Equilibrium Vapor Concentration
ATC: Acute Toxicity Concentration
| Name of EHS | CAS no | Minimum Quantity in Pounds |
|---|---|---|
| Hydrogen Chloride | 7647-01-0 | 2,000 |
| Hydochloric Acid 36% by weight HCl | 7647-01-0 | 5,600 |
| Allyl Chloride | 107-05-1 | 2,000 |
| Hydrogen Cyanide | 74-90-8 | 500 |
| Hydrogen Fluoride (HF) | 7664-84-1 | 500 |
| Hydrofluoric Acid >70% by wt | 7644[84-1] 39-3 | 700 |
| Chlorine | 7782-50-5 | 500 |
| Phosphorous trichloride | 7719-12-2 | 500 |
| Hydrogen Sulfide | 7783-06-4 | 500 |
| Phosgene | 75-44-5 | 100 |
| Bromine | 7726-95-6 | 100 |
| Methyl isocyanate | 624-83-9 | 100 |
| Toluene-2-4-diisocyanate | 584-84-9 | 100 |
List Published by EPA
Substances That Can Cause Serious Irreversible Health Effects From Accidental Releases
3.15. Extremely Hazardous Substance
| Cas no. | Chemical Name | Threshold Reportable Quantity | Planning Quantity |
|---|---|---|---|
| 75-89-5 | Acetone Cyanohydrin | 10 | 1000 |
| 1752-30-3 | Acetone | 1 | 1000/10000 |
| 107-02-8 | Acrolein | 1 | 500 |
| 79-06-1 | Acrylamide | 5,000 | 1000/10000 |
| 107-13-1 | Acrylonitrile | 100 | 10000 |
| 814-68-6 | Acrytyl Chloride | 1 | 100 |
| 111-69-3 | Adiponitrile | 1 | 1000 |
| 116-06-3 | Aldicarb | 1 | 100/10000 |
| 309-00-2 | Aldrin | 1 | 500/10000 |
| 107-18-6 | Allyl Alcohol | 100 | 1000 |
| 107-11-9 | Allylamine | 1 | 500 |
| 20859-73-8 | Aluminum Phosphide | 100 | 500 |
| 54-62-6 | Aminopterin | 1 | 500/10000 |
| 78-53-5 | Amiton | 1 | 500 |
| 3734-97-2 | Amiton Oxalate | 1 | 100/10000 |
| 7664-41-7 | Ammonia | 100 | 500 |
| 16919-58-7 | Ammonium | 1 | 10000 |
| 300-62-9 | Amphetamine | 1 | 1000 |
| 62-53-3 | Aniline | 5,000 | 1000 |
| 88-05-1 | Aniline, 2,4,6-Trimethyl | 1 | 500 |
| 7783-70-2 | Antimony Pentafluoride | 1 | 500 |
| 1397-94-0 | Antimycin A | 1 | 1000/10000 |
| 86-88-4 | ANTU | 100 | 500/10000 |
| 1303-28-2 | Arsenic Pentoxide | 5,000 | 100/10000 |
| 1327-53-3 | Arsenous Oxide | 5,000 | 100/10000 |
| 7784-34-1 | Arsenous Trichloride | 5,000 | 500 |
| 7784-42-1 | Arsine | 1 | 100 |
| 2642-71-9 | Azinphos-Ethyl | 1 | 100/10000 |
IDLH = Immediate danger to Life & Health
- IDLH concentration has adverse effects on life and health for an exposure time of 30 minutes
PEL = Permissible Exposure Limit
- PEL is the time weighted concentration which should have no adverse effect on an average worker
- Hydrogen fluoride , HF, is very toxic
- It is used in a 18x24x9 ft lab
- If a container of HF is released into the room, what is the max amount that can be kept in the room, and still not pose an immediate danger to the lab staff?
- IDLH level for HF = 20 ppm
- PEL = 3 ppm
- MW HF = 20.01
- Boiling Point @ 1 atm = 67 deg. F
(1) Safe amount to have in the lab:
Calculate the volume of the lab:
V = (18)(24)(9) = 3888 ft3
The lab volume is needed since the HF will rapidly disperse throughout the room.
Calculate the moles of air present:
N = (PV)/(RT)
= (1.0)(3888)/(0.7302*530)
= 10.05 lb moles
Use the ideal gas law to calculate the total number of moles of air in the lab at
ambient conditions, 1.0 atmosphere and 70 oF (530oR).
Calculate the “safe” amount of HF:
A = (IDLH)(N)
= (0.000020)(10.05)
= 0.000201 lb moles
= 0.00402 lb
= 1.82 grams
The “safe” amount in this case would correspond to the IDLH level. At this level, workers would have adequate time to leave the room. The IDLH is given in units of ppm, i.e., parts-per-million by volume.
The answer is readily converted to lbs and grams.
3.19. Using IDLH and PEL to Evaluate a Potential Release- Laboratory ventilation system mixes the air thoroughly
- Air is changed every ten minutes
- Determine the time required to purge a sudden release of 150 grams of HF before the laboratory was safe to use.
(2) Time to purge lab from release
Of 150 grams of HF:
The lab can be considered a large stirred-tank with a residence time of 10 minutes.
The differential
equation describing the concentration of a substance initially present at Concentration
CO in such a tank is:
V(dC/dt)=-FC
Where V = tank volume
F = fluid flow rate
The solution to this equation is:
C = CO e-Ft/V
which can be arranged to:
t = -(V/F) ln (C/CO)
Calculate the initial concentration of HF in the lab:
Amount of HF = 150 grams
= 0.330 lbs
= 0.0165 moles
Convert 150 grams to lbs, then to lb moles.
CO = (0.0165/10.05)
= 0.00164 mole fraction
= 1640 ppm
Divide the number of lb moles of air present to get the mole fraction of HF. Multiply
by 1,000,000 to get ppm.
Calculate the air flow rate:
F = (3888)/(10) = 388.8 ft3/min
The room has a change of air every ten minutes.
Calculate the time needed to reach the PEL concentration:
t = -(V/F) ln (C/CO)
= -(3888/388.8) ln (3/1640)
= 63 minutes
4.1. Checklist Reviews
List of Questions About
- Plant Organization
- Operation
- Maintenance
- Other Areas of Concern
4.2. Objectives
- To improve human reliability and performance during stages of a project
- To ensure compliance with regulations and engineering standards
- To ensure requirements have not been neglected or overlooked
- Includes Pertinent Areas of Expertise
- Secures Services of Personnel in Each Area of Expertise
- Includes:
- Objective
- Frequency of Implementation
- Number of Personnel Required
- Qualification Requirement of Personnel
- Exhibits a Level of Detail that Reflects the Level of Complexity of Process
- Operating Procedures
- Inspection and Maintenance Procedures
- Operator Training Manual
- Vendor Specifications and Manuals
- Plot Plan
- Equipment Performance History
- Controls Description
- Emergency Procedures
- Problem Reports
Operation
- Test equipment performance
- Ensure facility is operated according to procedures
Standby or Shutdown
- Verify equipment status prior to removal for maintenance
- Cross- reference maintenance procedure checklist
Advantages
- Does not require advanced training
Disadvantages
- Focuses on one item at a time
- Does not recognize future sources of concern
- Effectiveness is only as good as the prior experience of person preparing the list
- Are procedures available and used when isolating equipment for maintenance?
- s Safety Department responsible for work order signature, or is this done by operations or maintenance personnel?
- Are blind lists made for each isolation job, who keeps them, and who checks that all are installed or removed?
- Is safety and life-saving equipment inspected on a regular basis, and who is responsible for this work?
- Are operators and maintenance personnel instructed and trained in firefighting and first-aid procedures?
- Are plant personnel trained to respond to major emergency situations?
5.1. Preliminary Hazard Analysis
- Hazard identification technique that focuses on the conceptual design phase of a project
- To eliminate costly delays due to design changes by identifying potential hazards of preliminary process design
Assess conceptual design to identify and examine hazards related to:
- Feedstock materials
- Major process components
- Utility and support systems
- Environmental factors
- Proposed operations
- Facilities
- Safeguards
Advantages
- Helps eliminate costly modifications
- Fortifies proposed process design by adding safety factors into design criteria
Disadvantages
- Cannot prioritize findings
- Not as systematic so relies heavily on the analyst
6.1. Safety Audit
- A hazard identification technique used to inspect a plant or process
- An auditor reviews critical plant features to verify or inspect
- Effectiveness of appropriate design criteria
- Operating conditions and procedures
- Safety measures
- Related risk management programs
- Exhibits a Level of Detail that Reflects the Level of Complexity of Process
- Certify that a plant’s safety program is in place
- Certify that the safety program is implemented effectively
Advantages
- Helps improve safety awareness of operating personnel
- Addresses possible hazards to prevent future incidents
Disadvantages
- Cannot indicate future frequency of problem occurrence
- Basis of design
- Process description
- Process flow diagrams
- Equipment data sheets
- P & ID’s
- Maintenance Procedures
- Site Location Drawing
- Electrical area classification drawings
- Specifications for Piping, Controls,& Instrumentation
- Emergency preparedness information
Safety Audit Objective: To assist in upgrading existing facilities to an acceptable level of safety
- Visual inspection of plant
- Review of plant operating & maintenance logs
- Comparison of actual plant to design
- Comparison of design specification to procedures
- Interviews with plant operators and maintenance
- Detailed final report
- What is the level of firefighting equipment or capability in the plant?
- Is an automatic gas or vapor detection system installed showing location and alarm points in control room?
- Is the fire water system tested on a regular basis?
- Are steam or water curtains provided for critical equipment and areas?
- Are automatic fire-extinguishing systems installed( carbon dioxide, foam)?
- Is safety consciousness emphasized?
- Are good safety records rewarded in any way?
Conclusions must be documented in a report.
Report Includes:
- Recommendations
- Overview of the plant and process
- Level of performance identified
Report Also:
- Identifies focus of future audits
- Acknowledges previous modifications
7.1. What-If Analysis
- Method used to conduct hazard analysis
- Does not require special quantitative methods or extensive preplanning
- Uses input information to generate checklist
- Used during the design stages of process as well as during the operating lifetime of a facility
Addresses
- Process chemistry
- Operating procedures
- Maintenance procedures
- Operator job descriptions
- Process flow diagrams
- P&IDs
- On-site chemical Inventories
- Other design documents
- Define scope
- Define source and boundaries
- Select team
- Document selection
- Formulate and evaluate questions
- Process chemistry description
- Operating procedures
- Maintenance procedures
- operator job descriptions
- Process flow diagrams
- P&IDs
- Hazardous Material Inventories
- Other Documents
- What - If questions
- A description of corresponding consequence or hazard
- An assessment of criticality based on the potential release rate
- Recommended action to mitigate the hazard
| What-If Question | Answer/Hazard | Critically | Possible Recommendation |
|---|---|---|---|
| The FCC main columns overhead vapor line ruptures? Note. This applies to all lines connected main column and main column overhead receiver. | Emergency shutdown procedure would be initiated. Inventory of reactor and column and gas concentration unit (until is blocked in) would be released to the atmosphere. Since this stream is cooler than the reactor outlet, potential for autoignition is reduced. So H2S may nit be combusted. | M | Follow standard procedures and practices. Notify state and local responsible agencies. |
| The level gauge on the main column overhead receiver breaks? | H2S in a hydrocarbon vapor steam would be released until operator breaks in level gauge. Operator would be altered by erratic pressure and level readings in control room and level alarms. | M | Follow standard procedures and practices. |
| Tube in interstage cooler ruptures on gas concentration unit(GCU)? | Hydrocarbon would be released into the cooling water. The H2S stripped by the air exiting the cooling tower. | M | Hydrostatically test bundles plug leaks when mechanically cleaned. |
| Tubes in high pressure cooler ruptures on GCU? | same as answer to 28. | M | same recommendation as WHAT-IF question 28 |
| Tubes in primary absorber lower inter cooler ruptures on GCU? | Same as answer to 28. | M | same recommendation as WHAT-IF question 28 |
| Tubes in primary absorber upper inter cooler ruptures on GCU? | same as answer to 28. | M | same recommendation as WHAT-IF question 28 |
- Multidisciplinary team should conduct the analysis
- Questions should be prepared in advance
- Analysis must be presented in tabular format
- Process operator
- Process engineer
- Maintenance engineer
- Safety or plant manager
- Equipment failure
- Process condition upsets
- Operator improvisation, poor performance, or inattentiveness
- Departures from operating procedures
- External events
Summary Tabulated
Critical Ranking Assigned
- Commonly used Criteria
- Estimated Release Amounts
- Number of affected workers
- Reported releases
- Equipment losses
- Simple
- Useful at all stages of plant life
- Relatively low cost
- Convenient tabular summary of a hazard and its consequence
- Relies heavily on team experience
- Subjective nature of analysis
- Qualitative results, but without numerical prioritization
8.1. Failure Mode and Effects Analysis (FMEA)
- Examination of individual components
- Assess the effect of their failure on subsystems and systems
- Emphasis on hardware failure
To organize and document what is known about the effect of component failures on a specified system
8.3. Failure Modes & Their Probability
8.4. Required Documentation
- P&IDs
- Electrical one-line diagram
- Instrument Logic/Ladder Diagrams
- Electrical Wiring Diagrams
- Instrument Loop Diagrams
- System description
- Vendor manuals
- Training manuals
- System operating procedures
- Identification of component and parent system
- Failure mode selected
- Effect of the failure on the system
- Method of detection
- System and operator response
8.7. FMEA Data Sheet
| Drawing | Component Indentifier | Component and Failure Mode | Method of Failure Detection | Effect of System | Other Remarks |
|---|---|---|---|---|---|
| HF-A-C | A001AIRM | line drainers | 768 | wet air | |
| HF-A-C | A002AIRM | plant air system drainers (2of2) fail | insert text | wet air | |
| HF-A-K | A003AIRM | Aftercooler trap A fails closed |
321 | Compressor A fails | |
| HF-A-G | |||||
| HF-A-D | Aftercooler trap B fails closed | ||||
| HF-A-F | A004AIRM | Compressor B fails | |||
| HF-A-G | Aftercooler trap C fails closed | ||||
| HF-A-D | Aftercooler trap D | Compressor C fails | |||
| HF-A-J | A005AIRM | ||||
| HF-A-G | Compressor D fails | ||||
| HF-A-H | A006AIRM |
- Ease of construction at the component level
- Ease of interpretation by the layperson
- Requires less time than a more detailed study methodology
- Quickly reveals fatal single failures when properly executed
- Addresses one component at a time
- Fails to develop sufficient detail
- Requires high grade experience
9.1. Hazard and Operability Studies (HAZOP)
- Simple methodology for hazard identification
- Allows user to employ imaginative thinking in the identification of hazards and operational problems
Anything that can lead to an unwanted event
- Runaway chemical reaction
- Equipment malfunction
- Operator error
9.3. Operability
Anything that causes an operator to improvise in his or her actions
9.4. HAZOP- Identifies hazards of operability problems
- Provides management with knowledge of potential hazards
- Provides vehicle for recommendations
- Provides safety-related information for every system
- Provides basis for risk management program
- Verify P&IDs
- Set line segment boundaries
- Compile list of support documents
- Tentative scheduling
- Recording technique
- List standard abbreviations and acronyms compiled
- Devise critical rankings
- Give HAZOP training to all team members
- Arrange for process/system briefings before begin work
- 9.7. Typical Preparatory Steps(contd.)
- Introduce team members
- Present HAZOP methodology
- Discuss AHM properties
- Identify hazards, goal, and scope of HAZOPClassify risk matrix parameters
- Define AHM release scenarios
- Give detailed process description
- Prepare computer program to record proceedings
- Conduct plant walk-through
- Hold team meetings to review facilities
- Prepare interim report for management
- Prepare a formal report of results
- Provides an overview audit of plant facilities
- Provides a general feeling for the condition of the unit
- Helps team in assessing hazard criticality and probability
9.9. Risk Matrix
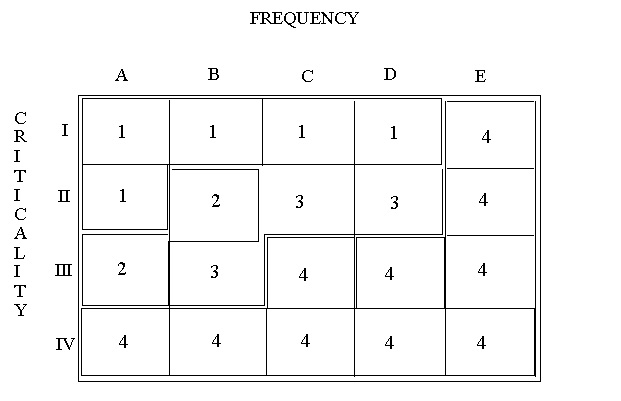
9.10. Definitions and Recommended Actions
| Ranking | Description | Required Mitigation |
|---|---|---|
| 1 | Unacceptable | Should be mitigated with engineering or administrative controls to a risk ranking of 3 or less within a specified time period such as 12 months. |
| 2 | Undesirable | Should be mitigated with engineering or administrative controls to a risk ranking of 3 or less within a specified time period such as 12 months. |
| 3 | Acceptable with controls | Should be verified that procedures controls are in place. |
| 4 | Acceptable as is |
- HAZOP identification
- List of team members
- List of reference documentation
- List of preliminary identified hazards
- Basis of risk matrix
- List of base study documents reviewed
- Purpose and scope defined
- Key members present
- Documentation used
- Preliminary hazard identification
- Criticality evaluation
- Procedures addressed
- AHM, MSDS addressed
- Spill size quantified & evaluated
- Instrumentation addressed
- Thorough cause investigation
9.13. HAZOP Illustration
For each section of a plant, the team reviews:
- Intention: How the process is suppose to operate?
- Deviations: Guide words used to suggest other ways the process might operate
- Causes: Is it realistic that these deviations could occur and how?
- Consequences: Result if deviation occurs
- Hazards: Consequence result in a hazardous situation
Guide words to evaluate deviations:
- No or Not : The intended operation does not take place
- More or Less : The intended process takes place but to a greater or lesser degree than intended.
- As well as : Something else takes place as well as the intended process
- Reverse : The opposite of the intended operation takes place
- Other than : Something entirely different from the intended process takes place.
The flare header collects inert gases and light hydrocarbon vapors from several locations . The knock-out vessel is suppose to collect any liquids that might condense in the flare line . Estimates indicate between 10 and 500 lb per hr of liquid will reach the vessel.
Intention:
The knock-out vessel is designed to collect liquid hydrocarbons from the flare header and divert it to waste liquid recovery instead of having it burned in the flare.
Deviations:
- No: No liquid comes to the vessel.
- More or less: More than 500 lb/hr, or less than 10 lb/hr, of liquid comes to the vessel.
- As well as: Liquid water enters the vessel along with hydrocarbons.
- Part of: Does not apply.
- Reverse: Liquids flow from the vessel back into the flare header.
- Other than: The liquids do not separate in the vessel but go on out to the flare.
Causes:
1. A. No hydrocarbons heavy enough to condense are flowing in the flare header.
B. Flare header is blocked.
2. A. [More] Plant upset is venting more than expected amounts of condensable hydrocarbons.
B. [More] Liquids are leaking into flare header from some source in the plant.
C. [Less] Same as 1.A. and 1.B., above.
3. A. Water is leaking into flare header system.
B. Air with high moisture content is leaking into plant and into flare system.
C. Water is present in light hydrocarbons.
5. A. Check valve is installed backwards.
B. Block in line to flare causes pressure buildup in vessel.
6. A. Too much turbulence in vessel.
B. Vessel residence time is too short.
C. Vessel is full of liquid due to faulty level control.
D. Vessel is full of liquid due to blocked liquid exit line.
Consequences:
1. A. Vessel could dry out, possible divergence of vapors to liquid waste recovery
unit.
1. B. Could result in unsafe conditions upstream in plant.
2.A. and 2.B. May be too much flow for liquid waste recovery unit.
3.A., 3.B. and 3.C. No major problem if liquid unit can handle water.
5.A. and 5.B. Flare won’t operate. Major safety problem.
6.A. and 6.B. Carryover of small amount of liquid to flare; no significant problem.
6.C. and 6.D. Carryover of large amount of liquid to flare; flare capacity could be exceeded.
Major hazards:
corrective action needed:
1.B., 5.A., 5.B., 6.C., and 6.D.
Moderate hazards:
corrective action needed:
1.A., 2.A., and 2.B.
No hazard:
3.A., 3.B., 3.C., 6.A. and 6.B.
10.1. Fault Tree Analysis and Event Tree Analysis
Determines how an undesired event occurs.
Uses results from hazard identification analyses.
Determines how often an event can occur.
10.2. Fault Tree Analysis FTA- Uses graphical diagrams to show logic behind the deductive reasoning
- Can be used on multiple systems as well as single systems
- Treats the issue of common cause failures
- Can produce quantitative and qualitative results
- J. F. Louvar and B. D. Louvar, Health and Environmental Risk Analysis, Prentice Hall, Upper Saddle River, NJ (1998)
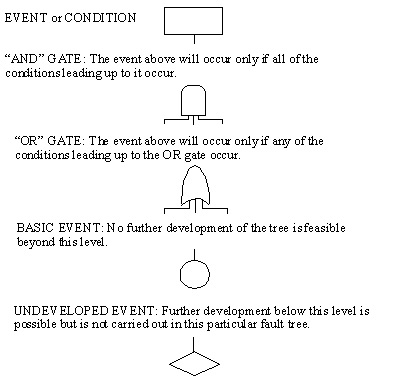
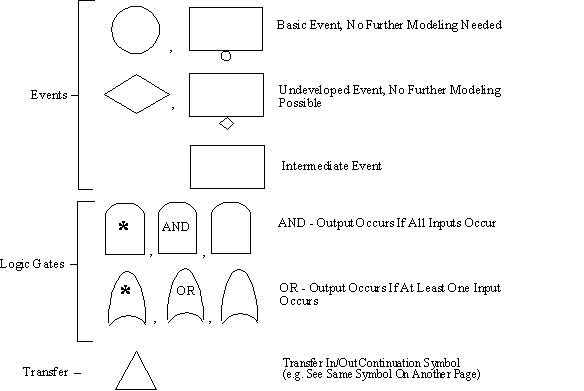
10.3. Fault Tree Analysis (FTA) Symbols
10.4. Event Tree Analysis (ETA)
- Used in conjunction with FTA
- Portrays an accident as a sequence of events
- Comparable to a decision tree
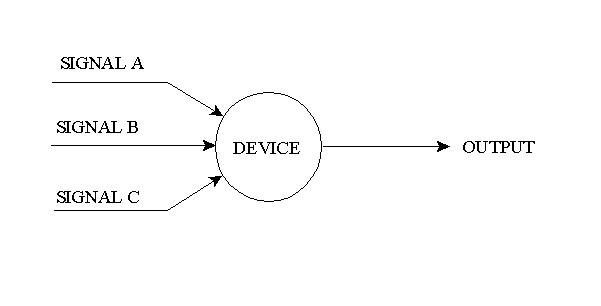
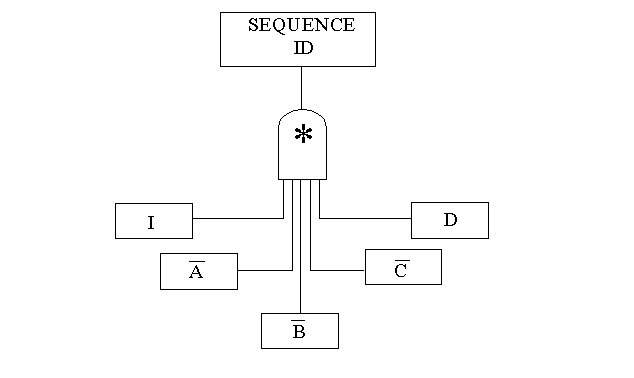
Defines logic relationships between simple events that combine to cause other events
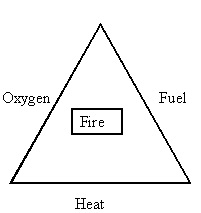
10.6. Fire Triangle
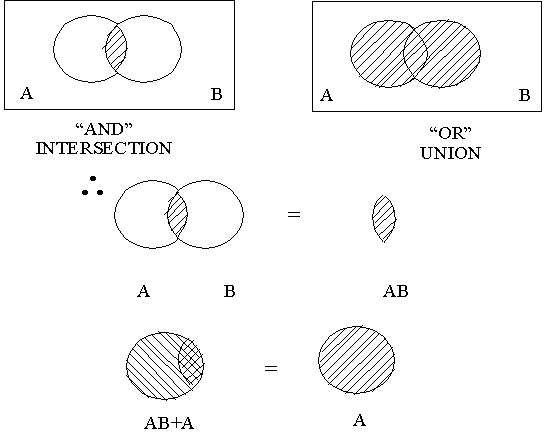
10.7. “ And / Or ” Logic
Output occurs if signal A and B occur or if signal A and C occur or if signal B and C occur.
Used to determine how a system can fail
Must first consider how success is defined for a system
10.9. Success Versus Failure Logic(contd.)
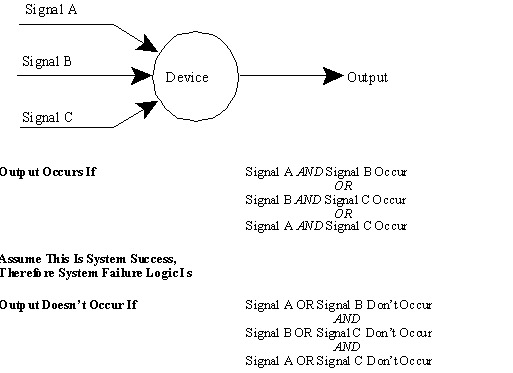
10.10. Success Versus Failure Logic(contd.)
- Boolean algebra is the basis for Fault Tree Analysis
- Sources used to identify success criteria
- System design criteria
- Process flow diagrams
- P&IDs
- Other design and operation documents
- Specific calculations
- Graphical Symbols combined for Logic Modeling
- Symbols grouped into 3 categories:
- Events
- Logic Gates
- Transfer symbols
10.12. Symbols Used in FTA
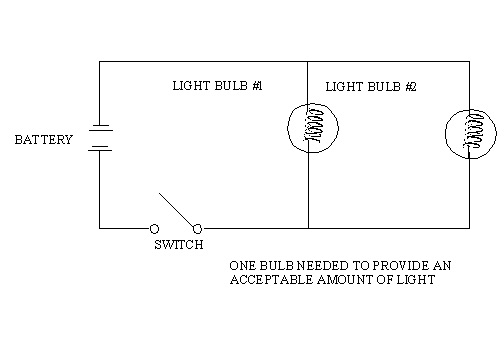
10.13. Electrical Circuit
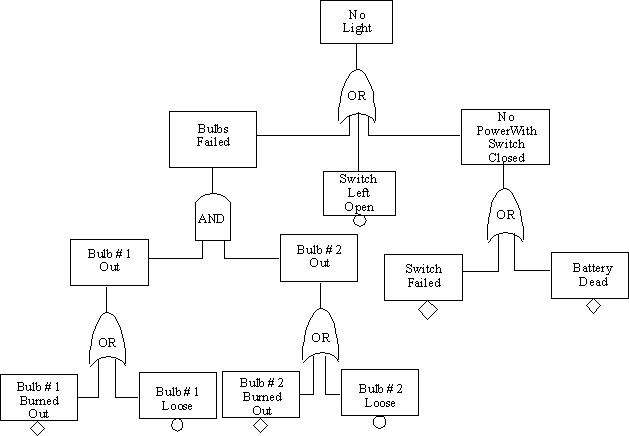
10.14. Fault Tree
10.15. Guidelines for Fault Tree Construction
Failure: Identifies the failure of a component to operate properly, or the failure of an operator to perform a certain task
10.16. Guidelines for Fault Tree Construction Fault- A more general term than failure
- Can include the proper operation of an item at an inopportune time
- Can include the failure of an item to operate properly
- All failures are faults…...not all faults consist of failures
Component Fault: primary, secondary, or command fault
Primary Fault: Occurs within a component’s design capabilities
Secondary Fault: Failure of the same pressure vessel , but at a pressure in excess of its design pressure
Command Fault: Relates to the proper operation of a component at the wrong place or time
Failure Effect: The effect of a component failure on a system
Failure Mode: An aspect of a component failure
Failure Mechanism: Describes specific ways in which a given failure mode can occur
Active Failure: Failure of dynamic component that must move or change its state to perform its function
Passive Failure: Failure of a component that is basically static (pipe, wire, or support beam)
10.18. More Guidelines- Work from top to bottom
- Write fault in box
- Keep steps between different conceptual levels small
- Use abbreviations, but do not lose the main idea
- The “No Miracles Rule” If the proper functioning of a particular component can cause a fault further along a system, assume the component performs its function normally
- No “Gate-to Gate Rule” AND and OR gates should not be directly connected to other gates
- “Complete the Gate” Rule: Develop the tree horizontally before you begin to develop the tree vertically
- Additional rules: Fault Tree Handbook, NUREG-0492, U. S. Nuclear Regulatory Commission, Washington, D. C. (Jan., 1981)
- Very useful in FTA
- Mathematics based primarily on variables that can have one of two values:
- true/false
- succeed/fail
- on/off
- happens/does not happen
- 1/0
10.20. Boolean Algebra Representation of a Fault Tree
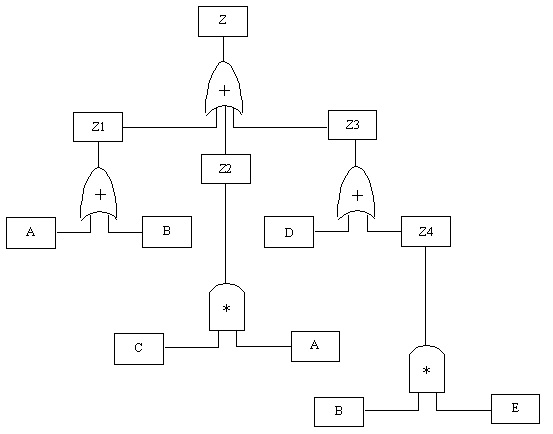
Boolean Equation:
Z=Z1+Z2+Z3
=(A+B)+(C*A)+(B*E)
=A+B+CA+D+BE
10.21. Boolean Review
Samples of Rearrangement Laws :
- A * B = B * A
- A + B = B + A
- A * (B * C) = (A * B) * C
- A + (B + C) = (A + B) + C
- A * (B + C) = (A * B) + (A * C)
- A + (B * C) = (A + B)* (A + C)
- (A + B) * (C + D) = (A * C) + (A * D) + (B * C) + (B * D) = AC + AD + BC + BD
Examples of the Cancellation/Absorption Laws:
- A * A =A
- A + A = A
- A + (A*B) = A
- A * (A + B) =A
10.22. Boolean Review(contd.)
10.23. Fault Tree Reduction and Equivalence
Reduction: The application of Boolean algebra to the fault tree to reduce it to a list of minimal cut sets
Equivalence: Two trees are equivalent if the reduction process produces the same minimal cut sets
10.24. Fault Tree Equivalence
10.25. Common Cause Failures
- Single events that can fail multiple components
- Some common cause failure categories:
- Shared Equipment
- Control Circuits
- Pneumatic Supplies
- Common Location
- Common ManufacturersCommon Maintenance Crew
- Electrical Power
- Cooling Water
- Operators
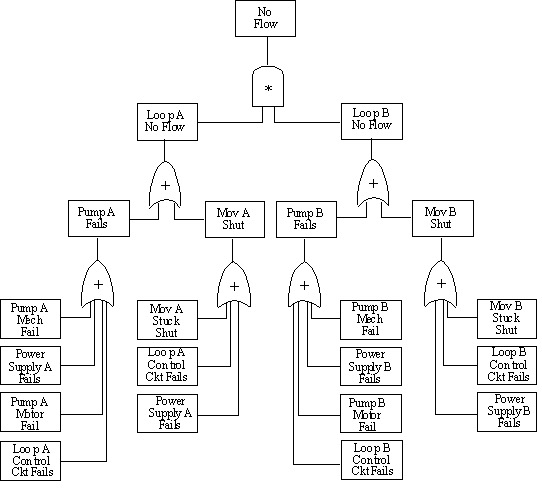
10.26. Common Cause Failures
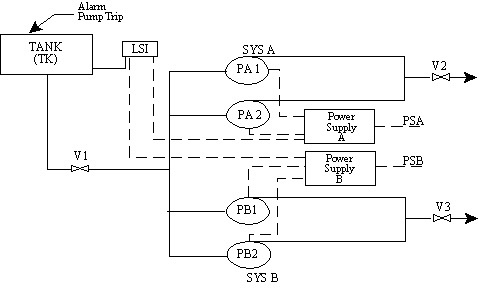
- Tank Supplies both System A and System B.
- Level Switch automatically trips all running pumps on low tank level and prevents restart. Operates Alarm
- Only one pump should be running in each system.
- Level switch receives power from both power supplies.
- Devise coding system for components (loops) to ensure consistent basic event labeling
- Ensure all of the support system common points will show up when modeling
- Use transfers to model support systems or shared equipment when model consists of more than one basic event failure
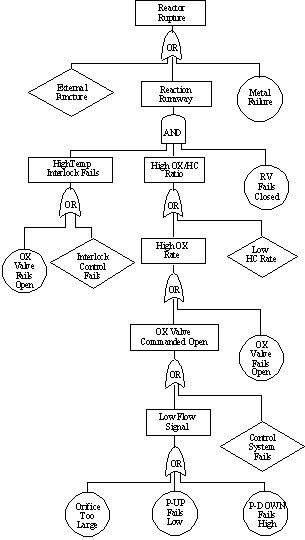
10.28. Fault Tree Analysis for a Reactor
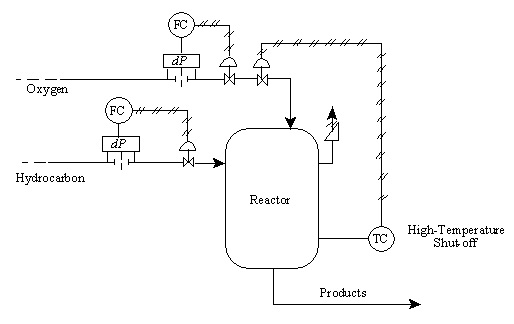
Symbols on the sketch include:
- dP: pressure difference measurement device, used to measure flowrate
- FC: Flow rate controller
- TC: temperature controller
- RV: relief value
- AOFC: "air open-fail close": indication that a valve requires positive controller pressure to open and will automatically close should the instrument air supply close
- Exothermic reaction is the partial oxidation of a hydrocarbon
- Reaction occurs at moderately high temp and pressure
- The O2:HC ratio must be kept within a fairly narrow range for a successful reaction
- Runaway exothermic reaction likely if O2:HC ratio is too high
- Determine the possible causes for a reactor rupture.
- Both internal and external events could cause reactor failure. Failure could occur under normal operating conditions or under runaway conditions.
- Develop the causes for the runaway reaction branch of the tree.
- Even if a runaway starts, several simultaneous events would be necessary for the reactor to rupture.
- Continue until "basic events" are reached.
- Basic events are conditions such as failure of an instrument or valve.
Note that there is not one unique fault tree structure that could be used to analyze this reactor.
10.31. Fault Tree for Rupture of Reactor
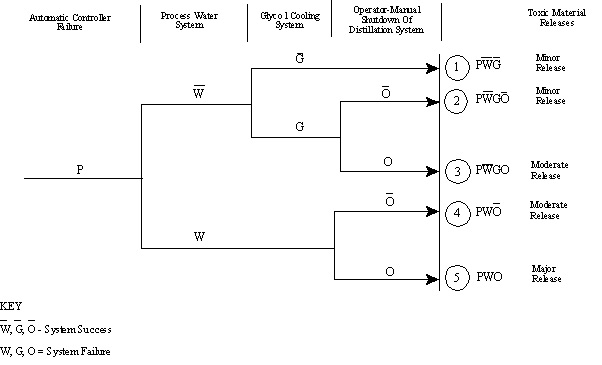
10.32. Event Trees
Modeling Multiple Systems Or Sequences of Events
- Follows precursors to an accident and defines a series of potential accidents of varying severity
- Portrays possible mitigation and protection systems where initiating event is the accident
10.33. Typical Event Tree
10.34. Multiple System Modeling
10.35. Linked Fault and Success Trees
When a fault tree is developed for a particular system, and the event sequence includes success of that system, we must change the fault tree into a success tree
10.36. Quantitative AnalysisRules:
- Fault trees are not quantified
- Minimal cut sets are quantified
- The equation representing the fault tree must be as simple as possible
- Can compare the relative risk of different options for risk reduction measures
- Gives a basis for doing benefit-cost analysis
- Draw trees
- Perform Boolean algebra
- Examine cut sets qualitatively
- Perform fault tree reduction
- Perform quantitative analysis
- Examine common cause failure
- Applied only to critical hazards, after other analyses have identified all of the potential hazards
- For systems in which an undesired event is suspected of being caused by more than one pathway
- When an undesired event can be stopped by more than one system or function
- When strong system interaction exists
- When the frequency of the undesired event is needed
- When undesired events can be caused by external events
- When undesired events cannot be stopped, slowed, or mitigated by a design feature
- When the system or function being considered is not supported by other systems
10.41. Evaluation of the probability of the top event occurring for a fault tree
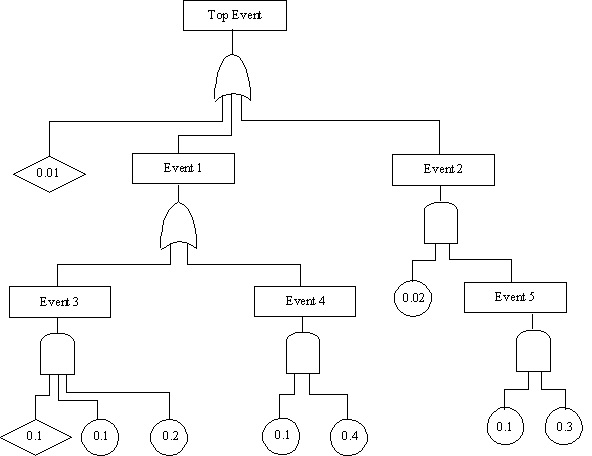
10.42. Evaluating Overall Event Probability for Fault Tree Analysis
Probability if n branches lead to the event through an AND gate
n
i = 1
Probability if m branches lead to the event through an OR gate
n
i = 1
Starting at the bottom, calculate the probabilities of each event.
- P5 = (0.1)(0.3) = 0.03
- P4 = (0.1)(0.4) = 0.04
- P3 = (0.1)(0.1)(0.2) = 0.002
Move up through each event to the top event.
- P2 = (0.02)(P5) = (0.02)(0.03) = 0.0006
- P1 = 1 - (1 - P5)(1 - P4) = 1 - (0.998)(0.96) = 0.04192
- Pte = 1 - (1 - 0.01)(1 - P1)(1-P2)
- Pte = 1 - (0.99)(0.95808)(0.9994) = 0.05207 top event
11.1. Chemical Plume Dispersion Analysis
- Integral part of risk assessment
- Link between potential equipment failure and consequences
- Provide insight to application of methods and models
- Models dispersion of postulated accidental releases of hazardous chemicals
- Estimates hazardous vapor concentrations to help quantify risk
- Forms the critical link between the hypothesized equipment failures or release scenarios and the potential consequences
The first step in dispersion analysis is identifying the source
11.3. ReleaseMay originate from any number of plant components including storage tanks, reactors, and piping
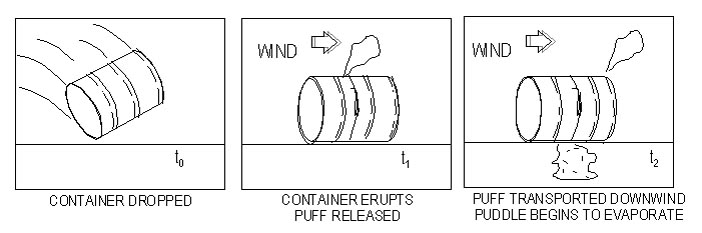
11.4. Possible Release Mechanisms
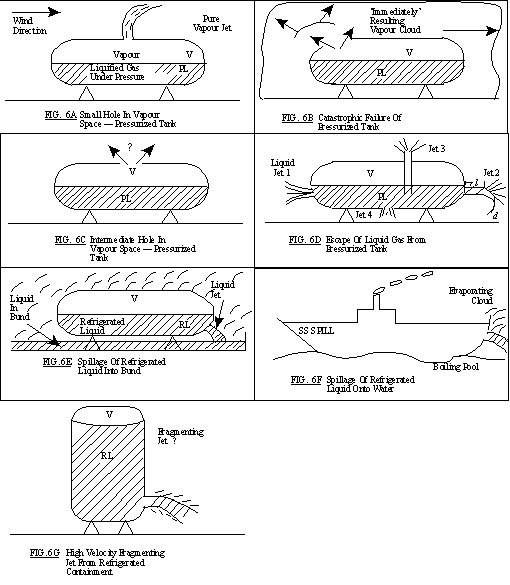
11.5. Source Characterization
To determine a source strength as a function of time, examine:
- Physical and chemical characteristics of the stored material
- Geometry of the source
- Plant operating procedures
Also examine:
- Spill surface characteristics
- Meteorological data
- Site characteristics:
- Local Topography
- Buildings
- Dikes
Must use the assumption of an instantaneous release for dispersion modeling
To determine liquid release rate from a storage vessel use Bernoulli’s Equation
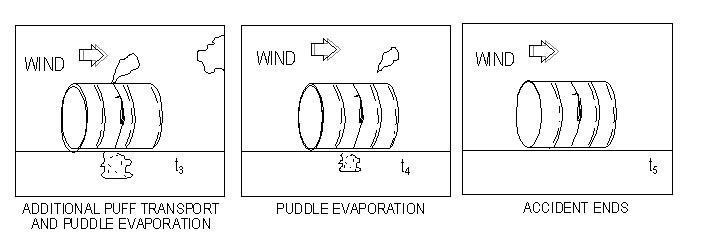
11.8. Bernoulli Equation
where
Q = liquid release rate (Kg/sec)
Cd = discharge coefficient (dimensionless)
P1 = density of the liquid (Kg/m3)
A = area of puncture (m2)
Pt = tank pressure (n/m2)
Pa = atmospheric pressure (n/m2)
g = gravitational acceleration (9.8 m/sec2)
h = liquid head (m)
Characterized as critical or sub critical
![]()
![]()
![]()
- Liquids with low boiling points
- Vapor fraction may be found with a heat balance equation
Mv/Mo = (Cp/Hv)(Ts-Tb)
where
Mv= mass of vapor due to flashing(Kg)
Mo= total liquid mass(Kg)
Cp= specific heat at constant pressure (J/Kg/oK)
Hv= Heat of vaporization (J/Kg)
Ts= storage temperature (oK)
Tb= liquid boiling point (oK)
Assume instantaneous release & spherical puff
![]()
- Another important source of chemical emission
- Formed by chemical spill in which chemical has a boiling point above ambient temperature
- Assume initial shape of the pool is cylindrical with height equal to radius of base
11.13. Liquid Pool Surface Area Calculation
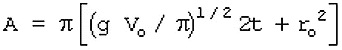
Basis: a cylinder with height equal to the radius of the base
where
A = puddle area (m2)
V0 = volume of spill (m3)
t = time from spill (sec)
r0 = initial radius of the spill (m)
g = gravitational acceleration (9.8 m/sec2)
For a liquid with a boiling point above ambient temperature
where
dQ/dt = vapor emission rate (Kg.sec)
D = diffusion coefficient (m2/sec)
L = characteristic length (m)
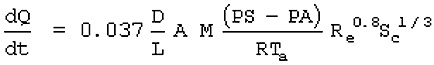
11.15. Evaporation Rate Calculation
For a liquid with a boiling point below ambient temperature
Evaporation rate is the sum of the heat transferred to the liquid by conduction, radiation and convection divided by the heat of vaporization. Conduction usually dominates.
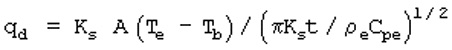
where
qd = heat transfer rate (watts)
Ks = thermal conductivity of the soil (watt/m/oK)
Tc = soil temperature (oK)
Tb = chemical boiling point (oK)
pe = density of earth's crust (Kg/m3)
Cpe = heat capacity of the earth's crust (J/Kg/oK)
Instantaneous and continuous releases require different methods
- Jet release dispersion
- Heavy gas dispersion
- Neutrally buoyant gases
- Density driven dispersion
- Cloud slumps and spreads out due to cloud weight
- Rate of cloud spread is estimated by an equation
Equation for Estimating Rate of Cloud Spread
This equation is based on the cloud forming a cylinder of height h.
![]()
Moment transport – mixing with ambient air.
Heat Transfer – conduction, convection, radiation.
Mass transport – diffusion and dispersion of plume species.
Chemical Reaction Kinetics – rate of formation of new species from the plume species
and air species.
- Atmospheric turbulence begins to dominate dispersion
- Chemical concentration in puff is described by an equation assuming material is distributed as a Gaussian plume
11.21. Estimating Chemical Concentrations with a Gaussian Plume Model
![]()
11.22. Model Performance and Uncertainty
Gaussian Model:
- Simplified solution to the dispersion problem
- Several assumptions must first be made for the model to be consistent with the model being analyzed
- Steady-state
- Spatial uniformity of meteorological parameters
- Terrain features uniform and similar to those present in the development of the dispersion coefficients
- Source emission constant over the averaging time of the model
- Pollutant mass conserved
- Predicted concentrations within a factor of two when actual plume approximated assumptions
Constraints:
- Heavy gas dispersion
- Non-steady-state releases
- Aerosol formation
Four general categories of emission sources :
- Dilute concentrations from large vent streams
- Vapor emissions from filling storage tanks
- Fugitive emissions from process equipment
- Accidental releases
Emissions from large vent streams: Emission of small amounts of unburned hydrocarbons from an oil-fired boiler
Vapor emissions: Vapor space in a tank rapidly reaches equilibrium with the stored liquid. When new liquid is added, vapor is displaced to the atmosphere
11.28. Air Emissions(contd.)- Estimate the amount of acetic acid vapor that would be vented to the atmosphere during the filling of a 10,000 gallon fixed-roof tank.
- Assume there are no vapor recovery controls on the tank and that the operation takes place at an ambient temperature of 70 deg F.
- The vapor pressure of acetic acid at 70 deg F is 12.24 mmHg. Its molecular weight is 60.05.
Calculate the mass of acetic acid vapor in equilibrium with liquid which will occupy
a volume of 10,000 gallons.
Convert the volume of the tank to ft3.
v = 10,000 gal = 1337 ft3
Convert the vapor pressure to psia and the temperature to oR.
Pv = 12.24 mm Hg = 0.237 psia
T = 73 oF = 530 oR
Apply the ideal gas law to calculate the moles of acetic acid.
N = PvV/RT = (0.237)(1337) - 0.0556 lb moles (10.73)(530)
Convert the moles to mass
N = (0.0556)(60.05) = 3.34 lb
Assume the vapor space in the tank rapidly reaches equilibrium with the first few gallons of acetic acid liquid.
There are 7.481 gallons per cubic foot.
There are 51.7 mm Hg per psi.
Adding 460 converts oF to oR.
Use the ideal gas law to calculate the total amount of acetic acid vapor in the tank.
Convert moles to lbs.
11.30. Estimating Air Emissions- When atmospheric pressure tanks are filled, the gases they contain must be vented to the atmosphere, to a flare, or to another vent system
- Some vent systems contain condensers which cool the gases to ambient temperature, thereby partially condensing the vapors and reducing the amount of air pollution and fire hazards
- A 2,000 bbl atmospheric pressure tank is to be filled frequently with cyclohexane
- The vapor space is filled with N2 at ambient temperature and pressure
Evaluate the amount of cyclohexane vapor emitted to the atmosphere if:
- There is no vent treatment
- Vent gases are compressed to 100 psia and cooled prior to release and the condensed cyclohexane is returned to the tank
Local Ambient conditions: 80oF and 1.0 atm
Cooler brings compressed vent gas to 85oF
Cooler condenses some of cyclohexane vapor
Cyclohexane properties:
- Molecular Weight - 84.16
- Vapor pressure @ 80oF - 2.051 psia
- Vapor pressure @ 85oF - 2.320 psia
Calculate the total number of moles of gas in 2,000 bbl at 80oF and 1.00 atm.
For Case 1, calculate the lb moles of cyclohexane and of inert gas in the released gas.
For Case 2, calculate the moles of cyclohexane that will still be vapor at 85oF and 100 psia.
For each case, convert the results to lbs of cyclohexane.
Use the ideal gas law. Remember that one barrel (bbl) is 5.614 ft3.The mole fraction of cyclohexane will be the same as the ratio of its vapor pressure to the total pressure.
Again, the mole fraction of cyclohexane will be the same as the ratio of its vapor pressure to the total pressure. The number of moles of inert gas will be the same as in Case 1.
Multiply the masses by the molecular weights.
11.34. Estimating Air Emissions(contd.)Calculate the total number of moles of gas in 2,000 bbl at 80oF and 1.00 atm
NT = PV/RT = (14.7)(2000 x 5.614)/(10.73 x 540) = 28.48 lb moles
For Case 1, calculate the lb moles of cyclohexane and of inert gas in the released gas.
Nc1 = (NT)(Pc/PT) = (28.48)(2.051/14.7) = 3.97 lb moles
Pi = PT - Pc = 14.7 - 2.051 = 12.649 psia
Ni = (NT)(Pi/PT) = (28.48)(12.649/14.7) = 24.51 lb moles
For Case 2, calculate the moles of cyclohexane that will still be vapor at 85oF and 100 psia.
Pi = PT - Pc = 100.0 - 2.320 = 97.68 psia
Nc 2 = (NT)(Pc/PT) = (28.48)(2.051/14.7) = 3.97 lb moles
For each case, convert the results to lbs of cyclohexane.
Mc1 = (3.97)(84.16) = 334 lb
Mc2 = (0.582)(84.16) = 50 lb
12.1. Explosion and Fire Analysis
Identify potential effects of chemical plant accidents on plant personnel and inhabitants of the surrounding area
12.2. Methodology- Identify the fire or explosion scenarios to be analyzed
- Postulate chemical release flow rates
- Identify the type of fire or explosion hazard
- Recognize the possibility for missile generation
Use hazard identification techniques to define the fire or explosion events to be analyzed
- FMEA
- HAZOP
- FTA
Chemical release rates are determined by applying the mechanical energy balance
Analysis Considers:
- Pipe resistances
- Component pressure drop
- Pump performance characteristics
- Chemical phase change effects
- Automatic control logic
- Operator action
- Determine phase: vapor, liquid, or solid
- Determine release rate
- Boiling liquid, expanding vapor explosion -BLEVE
- Unconfined vapor cloud explosion -UVCE
Catastrophic failures of equipment can result in equipment fragments being propelled to other areas of the plant
12.7. Fire and Explosion Characteristics- Boiling liquid, expanding vapor explosion BLEVE
- Pool fires
- Unconfined vapor cloud explosion UVCE
- Results from a rapid release and vaporization of a volatile chemical
- Typically follows a catastrophic tank rupture
- Chemical has a boiling point below the ambient temperature
- Produces intense thermal radiation
- Forms a fireball
- Can calculate:
- Radius
- Duration
- Radiant energy
- Radiant fraction of the fireball
- Radiant heat flux away from fireball
Radius of fireball (m)
m – mass of release
![]()
Duration of fireball ( sec)
![]()
Radiant energy released (joules)
Po - storage pressure (Mpa)
Qr - radiant heat flux
Ar - area of hemisphere
- Result from spills of liquid chemicals whose atmospheric boiling point is less than ambient temperatures
- Equations available to estimate
- Radius as a function of mass release or rate of release
- Burning rate
- Flame height
- Radiant heat release
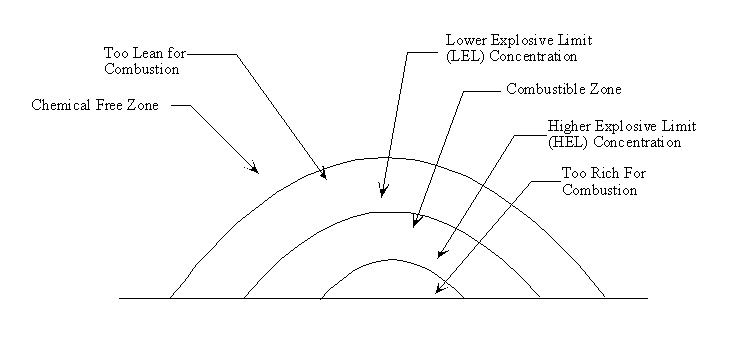
- Continuous release of a combustible gas into the atmosphere
- LEL
- Lower explosive limit
- High wind may disperse the gas limiting gas concentrations to below the lower explosive limit
- The lower limit for which explosion is possible
- HEL- The upper or higher explosive limit for which combustion is possible
12.13. Cloud Model for UVCE
12.14. Effect of Fires and Explosions on Personnel and the Plant
High heat fluxes resulting from chemical fires can cause injury to plant personnel, the public, and can damage the plant
12.15. Effect of Heat Flux on Human Health and the Plant
| Heat Flux (Kw/m2) | Effect |
|---|---|
|
1.75 |
Pain threshold reached after 1 minute |
|
2 |
PVC insulated cables damaged |
|
5 |
Pain threshold reached after 15 seconds |
|
6.4 |
Pain threshold reached after 8 seconds, Second degree burns after 20 seconds |
|
12.5 |
Wood ignites on prolonged exposure in presence of flame |
|
15 |
Limit for class 2 building materials |
|
16 |
Severe burns after 5 seconds |
|
25 |
Wood ignites on prolonged exposure |
|
30 |
Limit for class 1 building materials |
| Pressure (psi) | Effect |
|---|---|
|
5 |
Eardrum rupture threshold
|
|
15 |
50% probability of eardrum rupture |
|
30-40 |
Lung damage threshold |
|
80+ |
Severe lung damage |
|
100-200 |
Lethality threshold |
|
130-180 |
50% probability of lethality |
|
200-250 |
Nearly 100% probability of lethality |
Overpressure from 1.0 kg of TNT as a function of distance from an explosion is given by:
P (psi) = 1737/D2 + 1.875/D – 0.01156
(D1/D2) = (E1/E2)1/3
D is the range in ft from 3 to 400 ft
12.18. Estimating Energy of an Explosion from Damage Assessment(contd.)Damage correlations:
| Name of EHS | CAS no | Minimum Quantity in Pounds |
|---|---|---|
| Damage | psi OP | |
| Knock down people | 1 psi OP
|
|
|
Rupture eardrums |
5 psi OP | |
|
Lung damage |
15 psi | |
|
Fatality threshold |
35 psi OP | |
| 50% fatalities | 50 psi OP | |
|
99% fatalities |
65 psi OP | |
|
Break wood siding |
0.5-1 psi OP | |
|
Break cinder block walls |
2-3 psi OP | |
|
Break telephone poles |
5 psi OP |
12.19. Estimating Energy of an Explosion from Damage Assessment(contd.)
Following a major explosion at a chemical plant, the following damage conditions were noted:
- Windows shattered in office building 600 feet away from the center of blast
- Wooden utility poles knocked down up to 225 feet away
- Within 50 feet of center, total destruction of plant
Estimate the total energy release in the blast in terms of lbs of TNT and Btu
12.20. Estimating Energy of an Explosion from Damage Assessment(contd.)Select one of the damage criteria to get a distance/overpressure data point.
There is no data correlation for "total destruction". The correlation for window breakage has a factor of two range. The best choice to use is the utility pole breakage.
Calculate the distance that corresponds to this overpressure for 1.0 kg TNT explosion.
Solve the equation for D with P set at 5 psi.
Use the scaling formula to calculate the energy of the explosion in kg TNT; then convert to pounds of TNT and Btu.
Remember that 1.0 lb of TNT corresponds to 1983 Btu.
12.21. Estimating Energy of an Explosion from Damage Assessment(contd.)Select the overpressure of 5.0 psi for breakage of wooden utility poles to determine the distance from the explosion for 1.0 kg TNT.
- P = 1737/D2 + 1.875/D - 0.01156
- Solving: D = 18.8 ft
Wooden utility poles were broken 225 ft from the explosion. The scaling formula calculates the energy of the explosion in kg TNT as:
- (E2/E1)1/3 = (D2/D1)
- (E2/1.0) = (225/18.8)3
- E2 = 1714 kg TNT = (1714 kg)(2.2 lb/kg) = 3770 lb TNT
- E2 = (3770 lb TNT)(1983 Btu/lb TNT) = 7,480,000 Btu
13.1. Assessment Of Health Effects From Chemical Releases
Chemicals released into the environment carry a potential risk to human health
Health effects are a vital part of risk assessment
Extent of risk depends on many variables:
- Type of release
- Type of chemical
- Type of exposure
- Assess chemical characteristics
- Assess magnitude of potential release
- Determine toxicity of chemical
- Estimate amount of potential exposure to chemical received by the surrounding population
- Characterize health risks
Physical State: Refers to whether the chemical is in solid, liquid, or vapor phase upon release
Vapor Pressure: The pressure exerted by a vapor when it is in equilibrium with its liquid or solid phase
Vapor Density:- Density of the chemical vapor relative to the density of air at the same temperature
Solubility: Percentage of solute, by weight, that will dissolve in water at a given temperature; Must consider solubility because of ability of released particulate that may settle and contaminate surface water
Boiling Point: When the vapor pressure of the liquid equals the atmospheric pressure
Reactivity Data: Describes the stability of a substance as well as its compatibility with other substances, its decomposition products, and the likelihood of polymerization
Ionization Potential: The amount of energy needed to remove an electron
Flash Point: The lowest temperature at which a liquid will produce enough vapor to create an ignitable mixture in air
13.4. Assessing a Potential Release MagnitudeMagnitude: Refers to the amount of release, the surrounding population, atmospheric conditions that may affect dispersion, and size of the affected area
To estimate release, physical state must be known
13.5. Assessing a Potential Release ToxicityToxicity:- The ability of a substance to adversely affect the health of an organism
- The higher the toxicity of a substance, the more hazardous
- Affected by the route of exposure
Immediately Dangerous to life and health- IDLH represents the maximum concentration a worker can be exposed to without permanent adverse health effects
Median lethal dose (LD50): the amount that kills 50 % of the exposed test population
Median lethal concentration (LC50): The concentration that kills 50 % of the exposed test population through inhalation
Acute toxicity concentration (ATC): Refers to the lowest confirmed concentration level that caused death or permanent disability to the test subject
Permissible Exposure limit (PEL) & Time Weighted Average-Threshold Limit Value (TWA-TLV): Gives a level of contaminant to which an average healthy worker can be exposed for 8 hours a day, 5 days a week, without experiencing adverse health effects
13.6. Assessing a Potential Release ExposureChronic: Occurring in small amounts on a routine basis
Acute: Occurring in relatively high concentrations but infrequently
Level of Concern(LOC): Concentration of an extremely hazardous substance in the air where there may be serious irreversible health effects
13.7. Assessing a Potential Release Health RiskInhalation dose estimate IEX (mg/kg-day)
IEX = DICF/B(25,600/lifetime)
D – duration (hours/event)
I - inhalation rate (m3/hr)
C – contaminant air concentration (mg/m3)
B – body weight (kg)
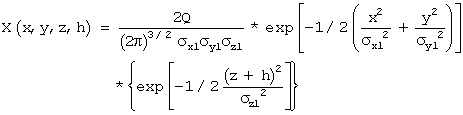
13.8. Assessing a Potential Release Toxic Air EmissionsFor an accidental release of a toxic chemical to the atmosphere, it is important to estimate the concentrations of the chemical at various locations at any time in the future. Chemical plume dispersion analysis is used to estimate this concentration distribution.
A pressure vessel containing 1500 lbs of hydrogen sulfide suddenly ruptures, releasing the contents to the atmosphere
Estimate the greatest distance downwind from the release at which the H2S concentration will exceed the threshold limit value, 10 ppm, the level at which there is imminent danger to life or health (the “IDLH” level)
The ambient temperature is 70oF, and the plant is at sea level. The weather is bright and sunny. There is a 10 mile per hour wind from the north. The molecular weight of H2S is 34.08.
The equation for chemical plume dispersion for estimating the ground level, downwind concentration from an instantaneous release of a vapor is:
C = 2M exp[10.5(x - ut)2/σx]/(2p)1.5( σx σy σz )
where C is the concentration of the chemical in the air at time t at a distance x, downwind from the release, M is the amount of release in moles, u is the wind velocity, σx, σy, and σz are dispersion coefficients in the directions parallel to the wind, perpendicular to the wind and perpendicular to the ground, respectively.
The dispersion coefficients are functions of weather conditions and distance from the source. Under the conditions of this problem the dispersion coefficients were correlated by:
σx = σy = 0.16 x 0.92 and σz = 0.71 x 0.73 ,with the σ’s and x in feet
Calculate the lb moles of H2S released:
M = (1500)/(34.08) = 44.01 lb moles
This converts lb to lb moles.
Calculate the molar concentration of air at these conditions:
Cair = P/RT = (14.7)/(10.73)(530)
= 0.00258 lb moles/ ft3
Use the ideal gas law to evaluate the lb moles of air per ft3.
Calculate the threshold limit concentration, of H2S:
Ct = 10-5 Cair
= 2.58x10⁻⁸ lb moles/ft3
The threshold limit is 10 ppm molar Ct, basis or 10-5 times the air concentration.
Inserting this information in the equation for chemical plume dispersion, and recognizing
that the maximum value for C at any point occurs when x = ut. Using Ct = 2.58x10⁻⁸
lb moles/ft3:
Ct = 2.58x10⁻⁸ lb moles/ft3 = [(2)(44.01)]/[(2 )1.5(0.16 x0.92 )(0.71 x0.73 )]
Solving for x gives:
x = 8,940 ft = 1.69 miles
This is the distance that the H2S concentration is greater than or equal to 10 ppm.
14.1. Quantified Risk Assessment
Allows the analyst to compare results in relative terms and allows the analyst to rank them in order of their effect on the plant or public.
14.2. Communicating Results- State overall objective of the risk assessment clearly
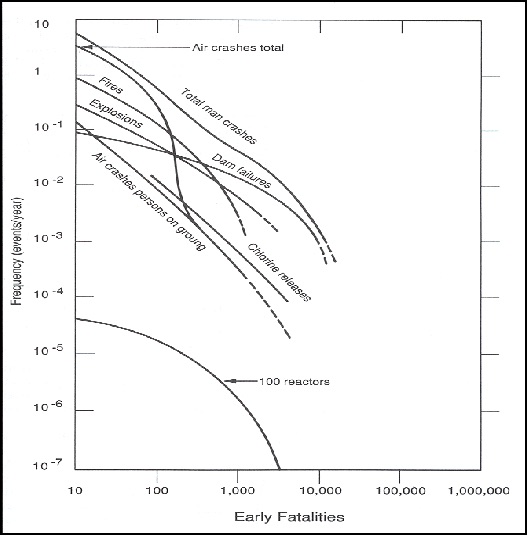
- Provide a perspective of comparison with other known or acceptable risks
- Show relative risk imposed by process compared to other factors
14.3. Data Collection & Management
Two types of data
- Plant specific
- Equipment failure frequency
- Maintenance practices
- Generic data from other sources
- Safety studies
- Identify and describe end objective
- List all components included in models
- Determine required level of detail for each model
- Establish operating exposure period
Collect:
- Operating age of equipment
- Period between failures
- Operating mode
- Maintenance performed
- Environmental conditions
Understand failure modes of system
14.6. Qualitative Uncertainty AnalysisFor parameter uncertainties and input data distributions
- A means of scoping the requirements for further analysis to reduce subsequent efforts
- Addresses the sources of errors
- States major assumptions
- Characterizes their potential on the results
- Assesses the degree of confidence in the results from an application
- Estimates the effects of:
- Randomness in the study parameters or input data
- Lack of precision in the models or in the predictions
- Initiating Events
- Classical estimation by distribution
- Bayesian techniques
- Breach of a pressure boundary
- Initiation of a batch reaction or startup procedure
- Classical estimation by distribution function
- Method of moments
- Event Tree Analysis
- Discrete probability distribution (DPD) arithmetic
- Initiation of a batch reaction or startup procedure
- Given a typical critical event
- Breach of a pressure boundary
- Initiation of a batch reaction or startup procedure
- A transient that activates a safety system
- A phase-to-phase or phase-to-ground electrical short
14.10. Relative Risks
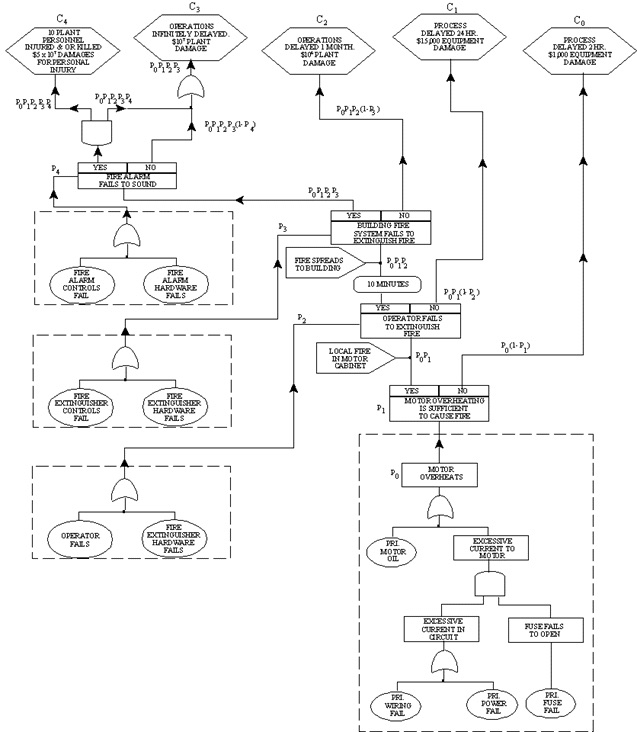
14.11. Cause - Consequence Analysis
- Trace sequence of events from initial critical event through many possible conclusions
- Branch at each decision point toward success or failure
- Create a cause - consequence diagram
- Apply estimates of probability and consequence to event
- Construct risk assessment curve
Probability Estimates for Cause-Consequence Diagram
Motor overheats (lower right hand corner) fault tree for initiating event. Probability
Po =0.088
Fire results Probability P1 = 0.02
Operator fails to extinguish fire P2 = 0.133
Fire extinguisher failure P3 = 10-5
Fire alarm control failure P4 = 5x10⁻⁵
Fire alarm hardware failure rate = 10-5
- Motor overheating no fire
- Down time loss
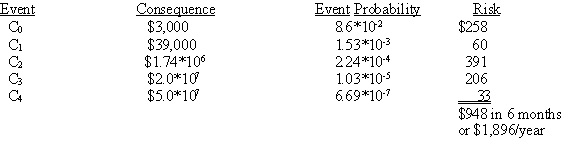
- Damaged equipment at $1,000 and $1,000 per hour for a two hour delay
- C0 [consequence] = $1,000 +2*$1,000=$3,000
- Estimate the probability of the consequence occurring
- Probability of the initiated event (.088) and probability that a fire will not start (1-.02)
- P0(1- P1) =.088 * (1- .02)= .086
- Risk for this event sequence:
- C0 [risk] = $3,000 *0.086 = $258
- Motor overheating causing a fire
- Lost production $24,000
- Damaged equipment of $15,000
- C0 [consequence] = $15,000 + $24,000 = $39,000
- Estimate the probability of the consequence occurring
- Probability of the initiated event (0.088) and probability of a fire (0.02) and the success of the fire extinguisher working (1-P2) = (1-0.133) = 0.867
- Probability of event sequence = PoP1(1-P2) = (.088)(0.02)(0.867) = 1.53x10⁻³
- Risk for this event sequence:
- C1 [risk] = $39,000 * 1.53x10-3 = $60
14.17. Cause - Consequence Analysis(contd.)
14.18. Risk Assessment Curve
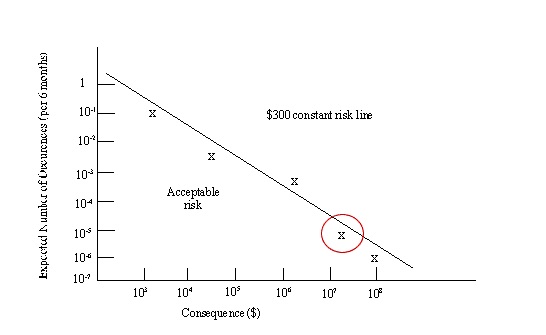
- Curve should show a constant risk line
- Constructed with information from risk calculations
- Events to left of line are acceptable
- Events to the right are unacceptable
14.19. Risk Assessment Curve(contd.)
This short course was designed to aid the practicing engineer who has responsibilities for risk assessment, management and reduction in chemical plants and petroleum refineries.
The topics for risk assessment have been presented in sufficient detail to judge their applicability for a current need and have supplied the background to apply these methods to chemical plants.
A risk assessment program brings together analytical tools to detect, prevent and mitigate risks associated with processing hazardous materials. These include HAZOP analysis, Event Tree Analysis, Explosion and Fire Analysis, Plume Dispersion Analysis and Health Effect Assessment.
Additional topics of importance to risk assessment are:
Human reliability
Emergency preparedness
Risk financing
Federal and state regulatory requirements
Training for industrial facilities
Regrettably time and space prevented describing these valuable topics.
Information Sources
Risk Assessment and Risk Management for the Chemical Process Industry, H. R. Greenberg and J. J. Cramer, Editors, John Wiley and Sons, New York, NY (1991)
Process Synthesis and Design, A Self-Instructional Problem Workbook, D. Kauffman, ETS International, Inc. Roanoke, VA (1992)
Additional sources, books and web sites, are given.
Acknowledgements
Melanie B. Mitchum, a chemical engineer now with ExxonMobil, prepared the major portion
of this short course.
Support was provided by EPA and the LSU’s Department of Chemical Engineering
Ralph W. Pike, Professor of Chemical Engineering at LSU directed the effort and is responsible for errors and omissions.
Additional Sources of Information
Books:
J. F. Louvar and D. B. Louvar, Health and Environmental Risk Analysis: Fundamentals with Applications, Prentice-Hall (1998)
Guidelines for Chemical Process Quantitative Risk Analysis, Center for Chemical Process Safety, AIChE, (1989), Second Edition (2000)
I. S. Sutton, Process Reliability and Risk Management, Van Nostrand Reinhold, (1992)
Web Sites:
www.aiche.org/ccps
www.process-safety.tamu.edu
www.primatech.com
www.epa.gov/opptintr/newchems
www.epa.gov/nerlesd1
http://www.epa.gov/swercepp/pubs/audit_gd.pdf